Ashley's Post
Sunday, July 17, 2011
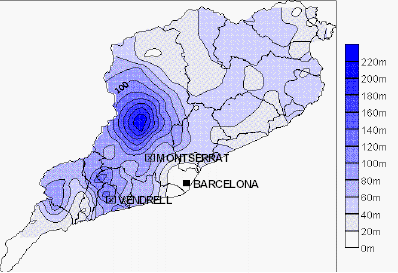
Isopleth Map
http://geographyfieldwork.com/DataPresentationMappingTechniques.htm
Isopleth maps use contour lines to measure equal values of a continuous variable. This isopleths map uses color and lines to shows the precipitation over Barcelona in June of 2000.
No comments:
Post a Comment
Newer Post
Older Post
Home
Subscribe to:
Post Comments (Atom)
No comments:
Post a Comment