http://www.cdc.gov/mmwr/preview/mmwrhtml/su6001a11.htm
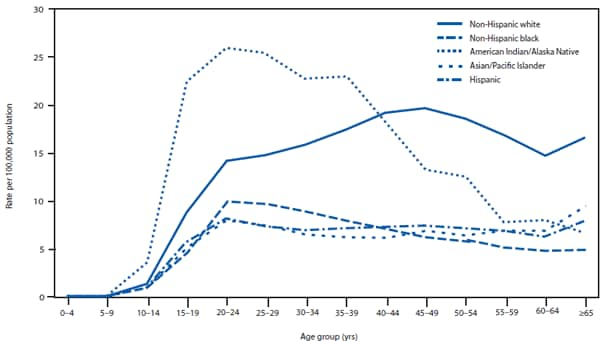
Line graphs display data by using a line to connect different value points. This line graph shows the rate of suicide per 100,000 in the populations for different ethnicities and age groups from 1999 to 2007 in the United States.
No comments:
Post a Comment